Abellminded Written up by Alex Abell, the team's coach. Not an official YWCA page.
Hack for Nonprofits 2026, Knoxville, November 19

Amy came with a hope.

Less time typing paper into systems. More time with the women in Keys of Hope. And numbers to show the people who fund the work, so the program can grow.

Five of us spent a day building toward it.

See what we made
Diagram: numbers that lived in two databases and on paper now flow, with one click each Friday, into one Keys of Hope report.

A home downtown

The Jenny Boyd Keys of Hope Women's Program is part of YWCA Knoxville & the Tennessee Valley. It gives affordable, supportive housing to women working toward recovery, stability and independent living.

Each woman gets case management, supportive services, and workshops on life skills, employment, and mental and physical health. The workshops and the meetings with a counselor are part of living here.

70 women can live here at once in YWCA's downtown Knoxville building

24 months, at most a woman can stay up to two years

2 Keys of Hope counselors they split the caseload between them

More about the program: ywcaknox.com/keys-of-hope
Before the event, we asked Amy how YWCA defines success for a woman in Keys of Hope. She wrote:

"Success means she leaves KOH, she leaves with more tools, more confidence, more stability, and more choices than she had when she arrived."

Amy Shelton, Director of Social Services, in writing. KOH is Keys of Hope.

She named six parts of it:

  • Stability
  • Self-sufficiency
  • Empowerment
  • Growth
  • Connection
  • Sustainability

The numbers lived in three places. One of them was paper.

Amy told us what she sees every day: women who take part in workshops and meet with their counselor tend to find permanent housing sooner. She had no way to show it.

EmpowerDB

The agency-wide database. Services, groups and case notes live here.

HMIS

The homeless management information system. Just each woman's entry and exit, for the city grant.

Paper

Workshop sign-in sheets and room assignments. Amy typed each sign-in sheet into EmpowerDB by hand.

Then, a spreadsheet

Each month, the numbers were typed again, by hand, into one spreadsheet.

Pulling anything out took so long that she only ever pulled the basics. That made it hard to show funders what the program does.

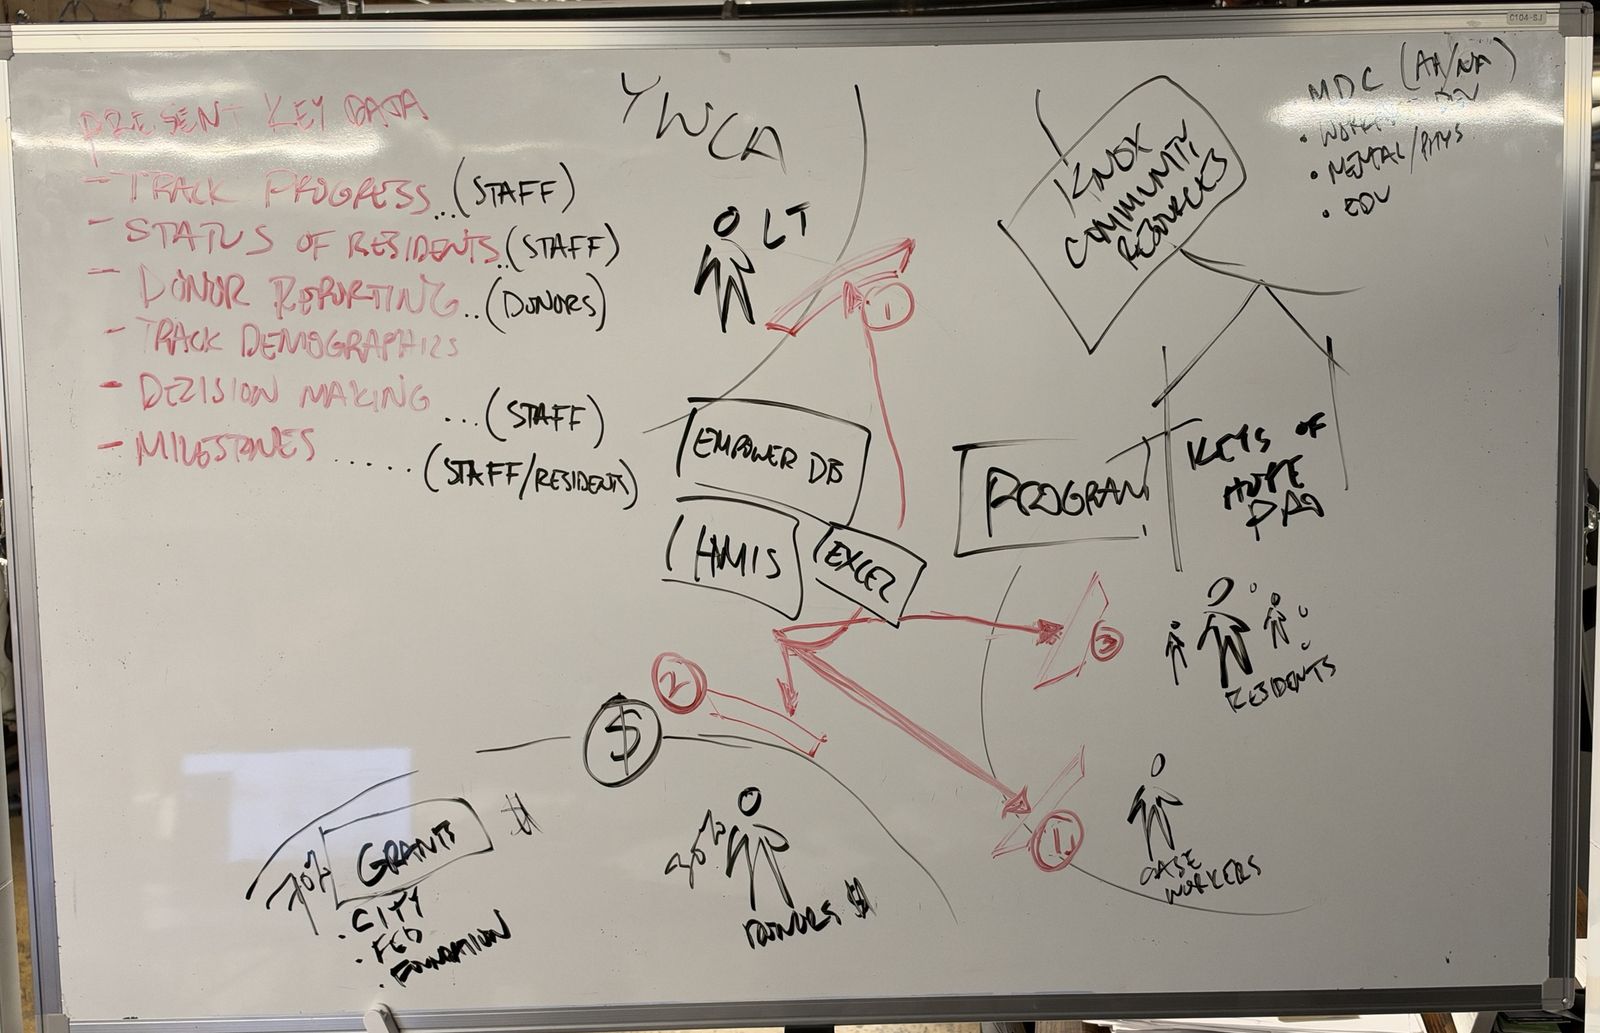
Whiteboard photo. On the left, a list titled key data: track progress, status of residents, donor reporting, track demographics, decision making, milestones. In the middle, boxes for EmpowerDB, HMIS and Excel, with red arrows running out to stick figures labeled leadership team, residents, case workers and donors, and to a box labeled grants: city, federal, foundation.
The first whiteboard of the morning. Bryan drew while Amy talked: who touches the program, and where the numbers go.
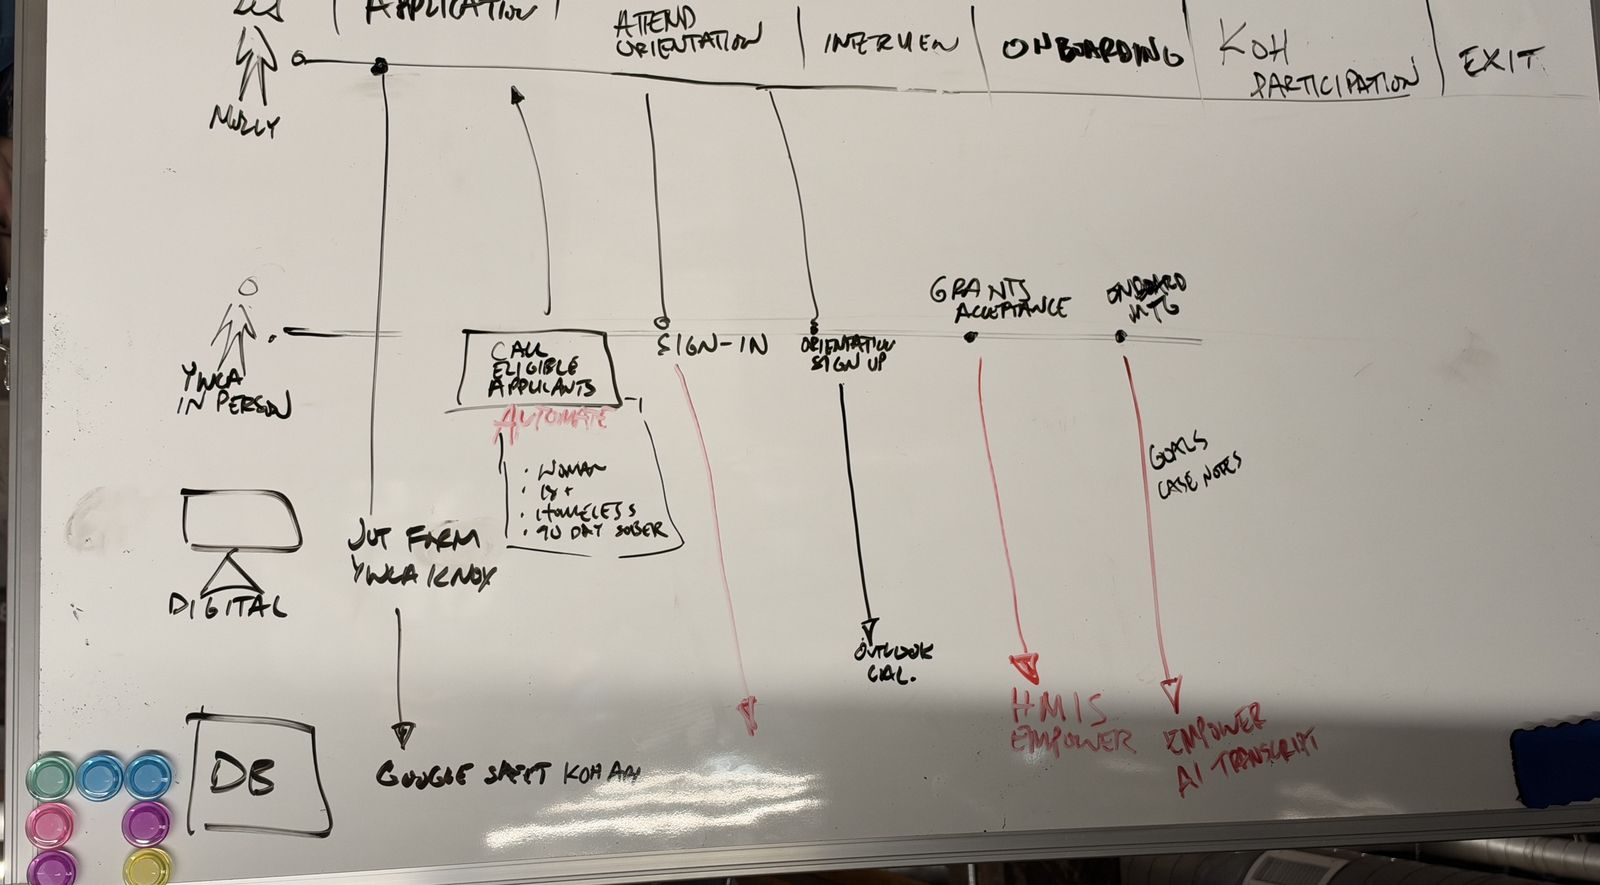
Whiteboard photo. Across the top, six stages in a row: application, attend orientation, interview, onboarding, Keys of Hope participation, exit. Below, lines drop from each stage to notes about where its record goes: an online form, a spreadsheet, a calendar, HMIS, and EmpowerDB. One box is marked automate in red.
The second. A made-up example woman, walked from application to exit. The red word says "automate."

A woman's path, and where each step leaves a record

  1. ApplicationAn online form.Lands in a spreadsheet
  2. OrientationShe signs up to attend.Lands on a calendar
  3. InterviewNo system was noted on the board.
  4. OnboardingGoals and case notes begin.HMIS entry, and EmpowerDB
  5. Taking partWorkshops and counselor meetings.Paper first, then EmpowerDB
  6. ExitWhere she goes next.HMIS exit, and EmpowerDB

The second whiteboard, redrawn so you can read it.

One Thursday, start to finish

Hack for Nonprofits pairs volunteer tech people with local nonprofits for one day. YWCA's ask was a clear, user-friendly dashboard for Keys of Hope in Power BI, the Microsoft program for reports.

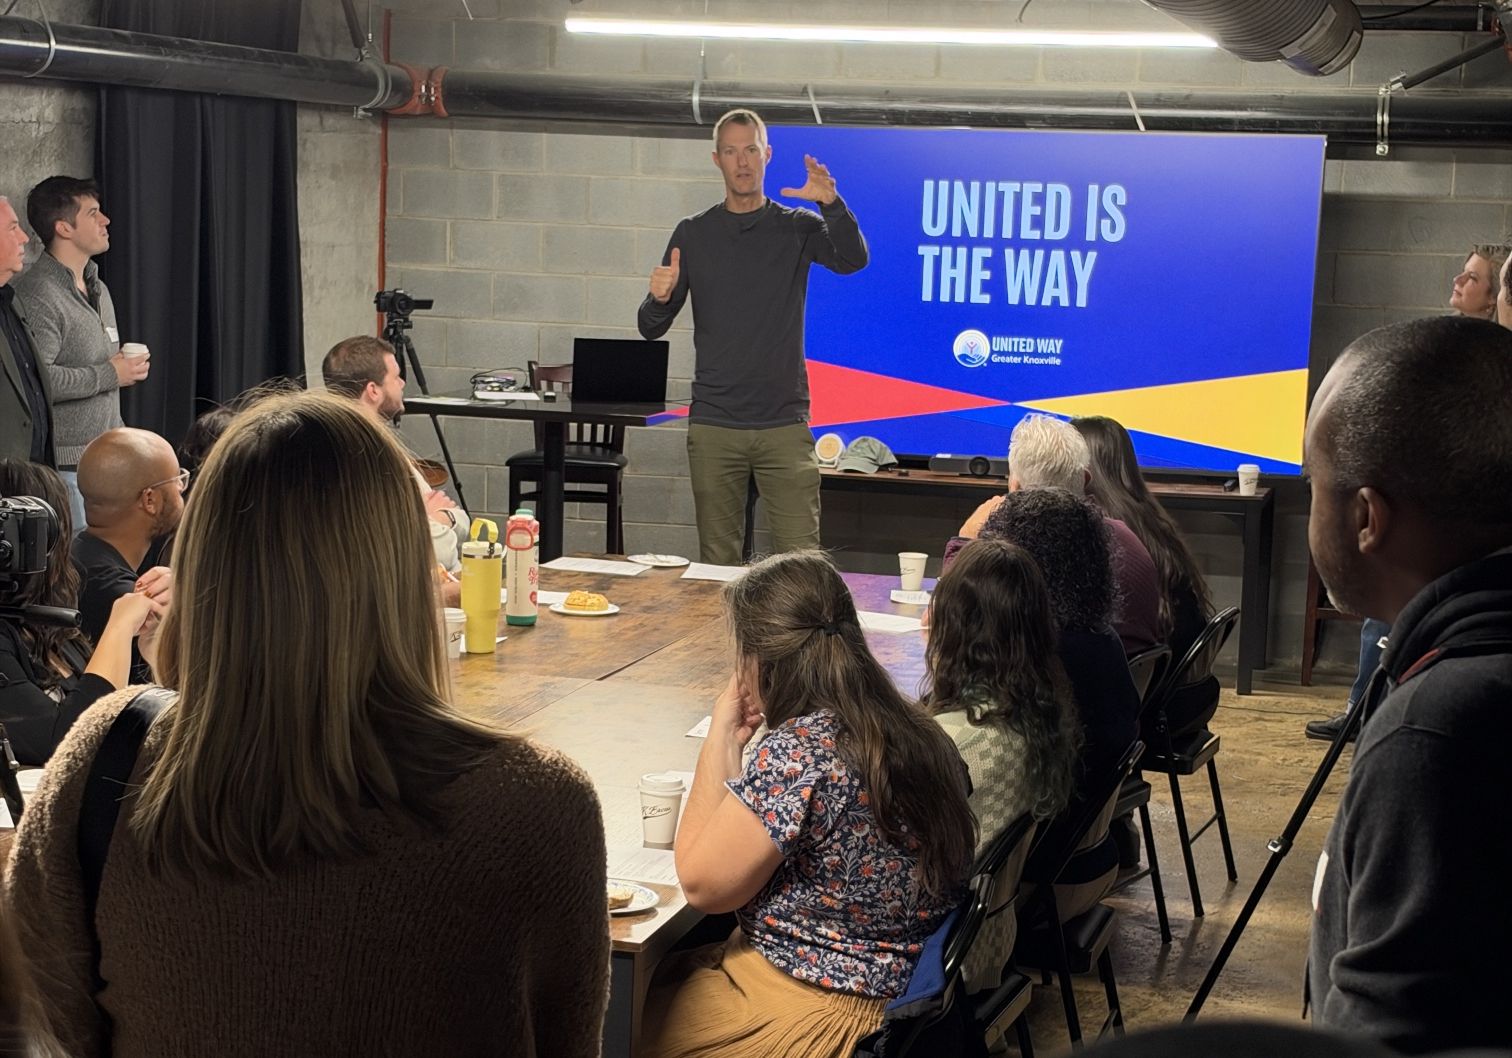
A basement room with a long wooden table. People sit and stand around it with coffee, listening to a speaker who stands in front of a large screen that reads United is the way, United Way of Greater Knoxville.
The room at 121 Tech Hub.
  1. 8:30
    Doors open

    Amy arrives with her laptop, her systems pulled up, and a few of the paper sign-in sheets she types in by hand.

  2. 9:00
    Two whiteboards, one morning

    Bryan and Amy work at the whiteboard. One board maps the people and systems. The other walks a woman's path from application to exit.

  3. Before lunch
    Staff first

    We named four audiences: donors and funders, counselors, leadership, and residents. Amy put staff first: one working view for the people who run the program.

  4. 1:00
    Two and a half hours

    The build sprint. Julianna updates the program's JotForm so a qualification step no longer needs a string of phone calls. Alex builds two prototypes, a working dashboard and a slide deck on made-up data. Robert joins partway through.

  5. 3:30
    Five minutes to present

    Each team gets five minutes. A whole day, said fast.

  6. That evening
    Homework

    After the event, Alex builds the two-page Power BI report. It reads four export files from one folder.

What we made

Five of these came out of that day and evening. The design kit was made the week before. The screenshots use made-up numbers, never real records.

The Power BI report

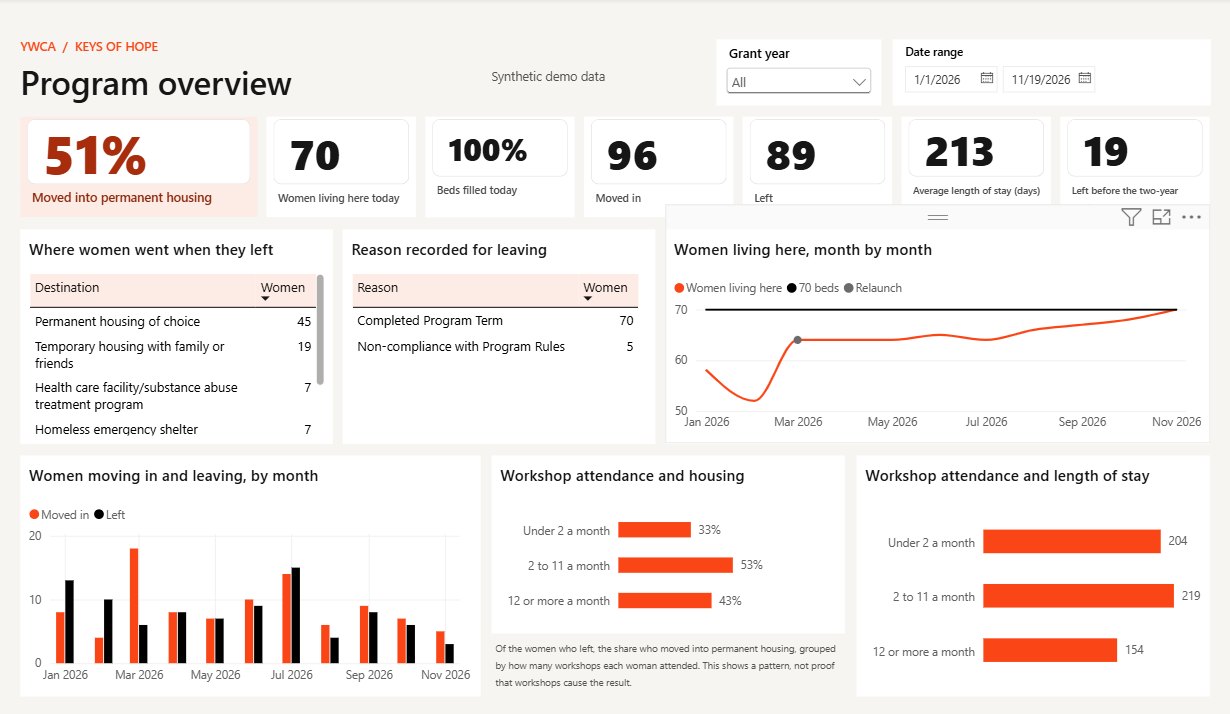
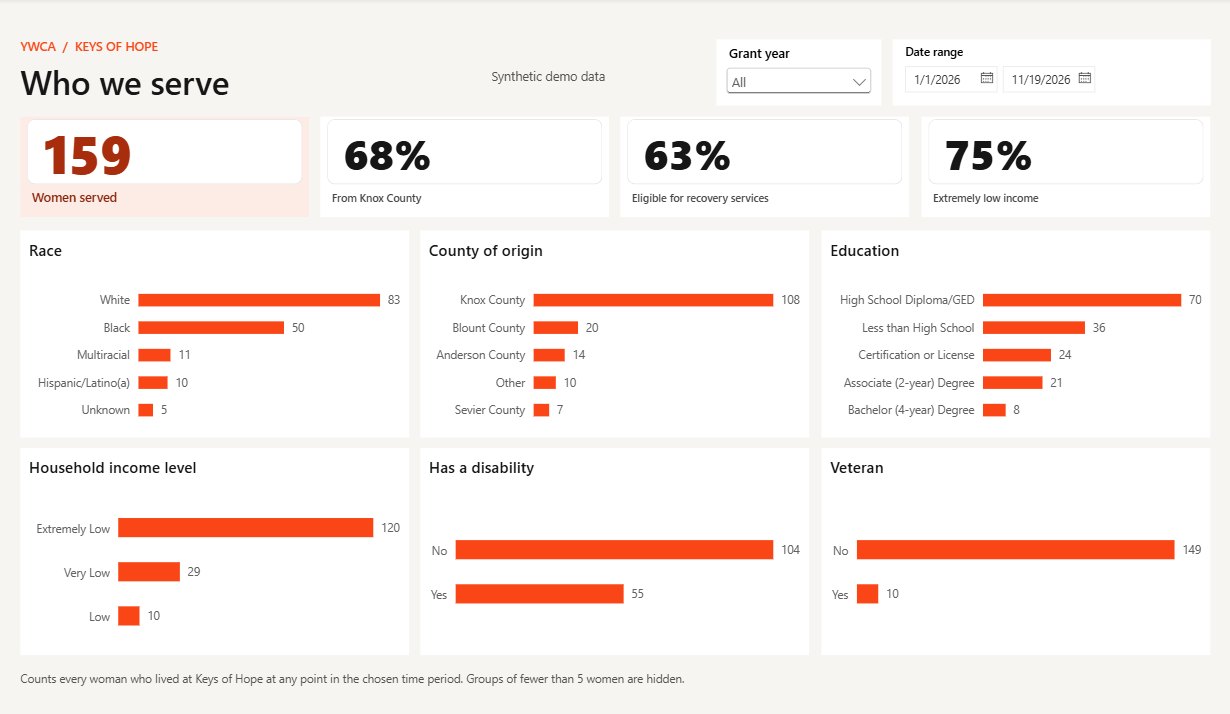
Two pages. The first shows who lives here now, who left, where women went, and workshop attendance beside housing outcomes. The second is called "Who we serve."

Made-up data Power BI report page titled Program overview. Cards of big numbers, two tables, a line chart with a marker at the March 2026 relaunch, and bar charts. All sample data.
Made-up data Power BI report page titled Who we serve. Four cards of big numbers above bar charts for race, county, education, income, disability and veteran status. All sample data.

Built that evening. Select a picture to see it full size.

A dashboard in one file

A simpler version that runs in a web browser. Pick the four export files and the page fills in. Nothing leaves the computer.

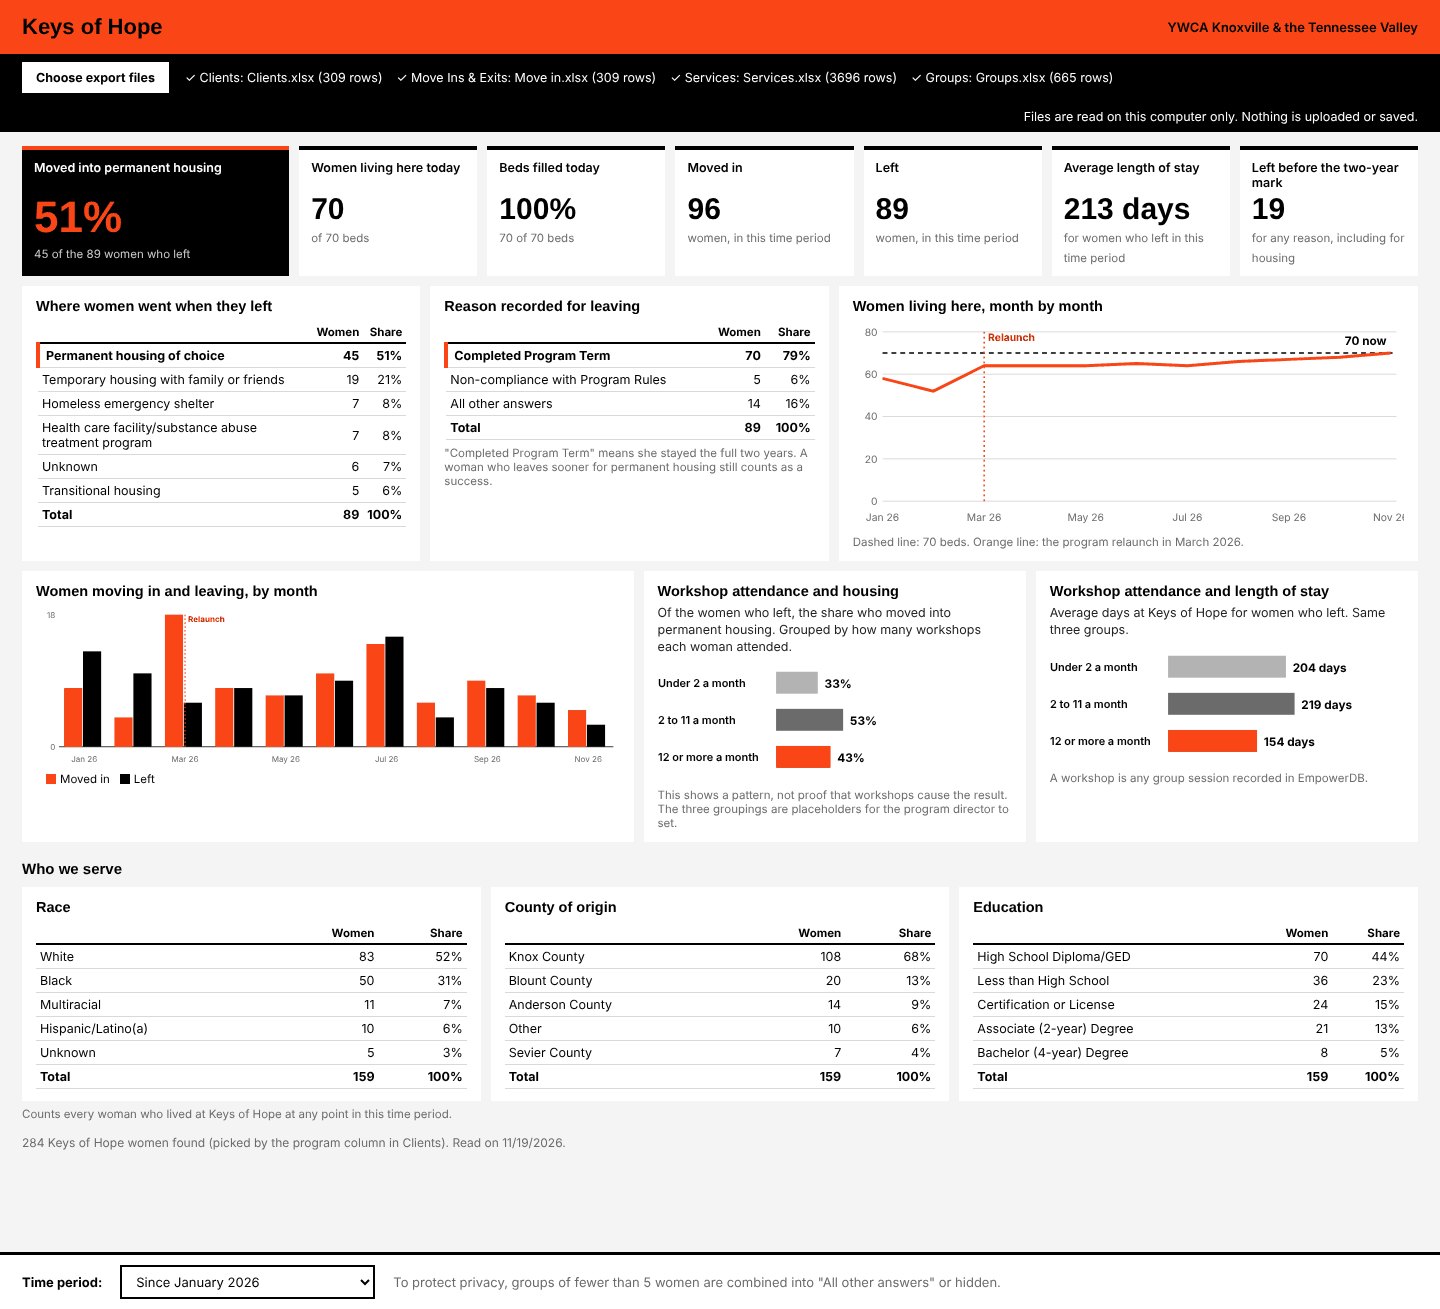
Made-up data The working dashboard in a browser. A row of big numbers across the top, then tables of where women went and why they left, a line chart of women living in the program by month, and bar charts of workshop attendance. All sample data.

Two prototypes first

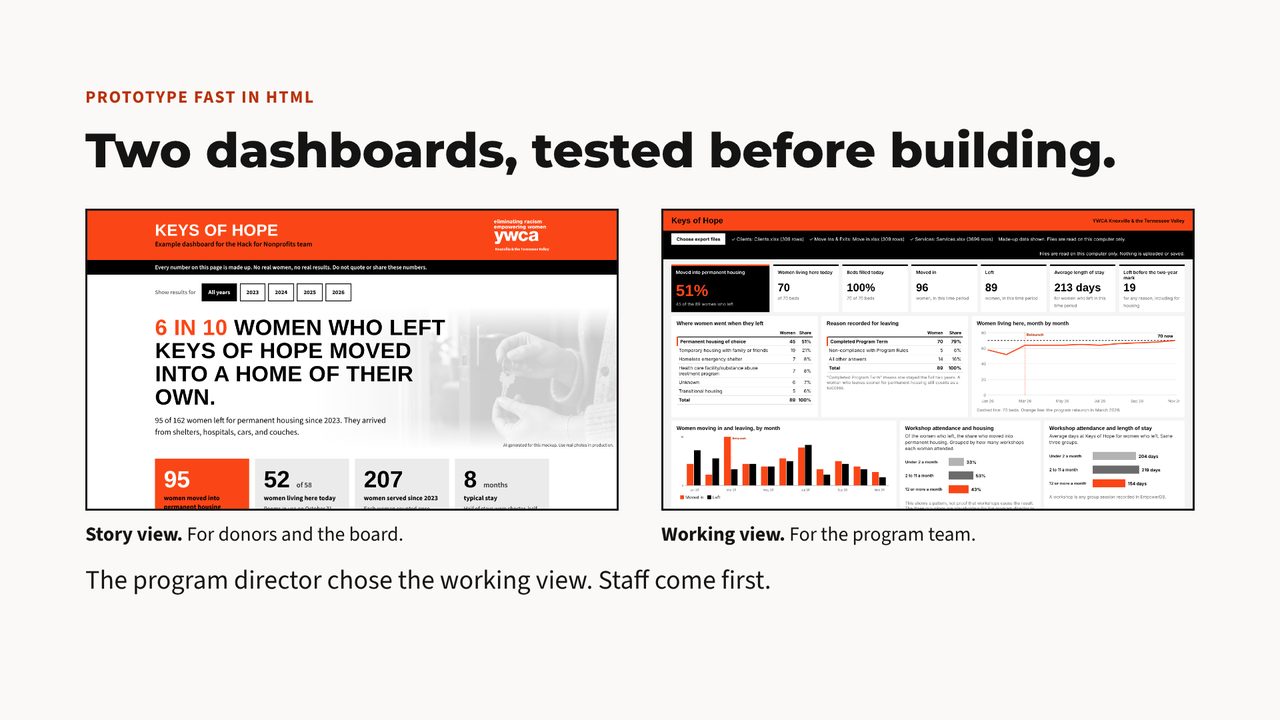
Before building anything real, we mocked up two versions as web pages: a story view for donors and the board, and a working view for the program team. Amy chose the working view.

Made-up data Slide titled Two dashboards, tested before building. Two small screenshots sit side by side: a story view for donors and the board, and a working view for the program team.

One qualification step, off the phone

Julianna updated a flow in the program's JotForm that handles a program qualification step. That step used to take many phone calls.

A handoff, in one zip

The Power BI template (it holds no data), a two-page guide, and an empty folder for the export files. It is in the staff section.

A design kit for YWCA

YWCA's 2018 brand guide and its two websites went in. Out came the colors, type rules, page parts, a Power BI theme, and writing and privacy rules, as plain text files. Hand them to any AI assistant and what it makes should look and sound like YWCA.

  • Persimmon
  • Black
  • White
  • Gray
  • Light gray

It is an unofficial draft. YWCA has not reviewed it. Where the kit and YWCA staff disagree, staff are right.

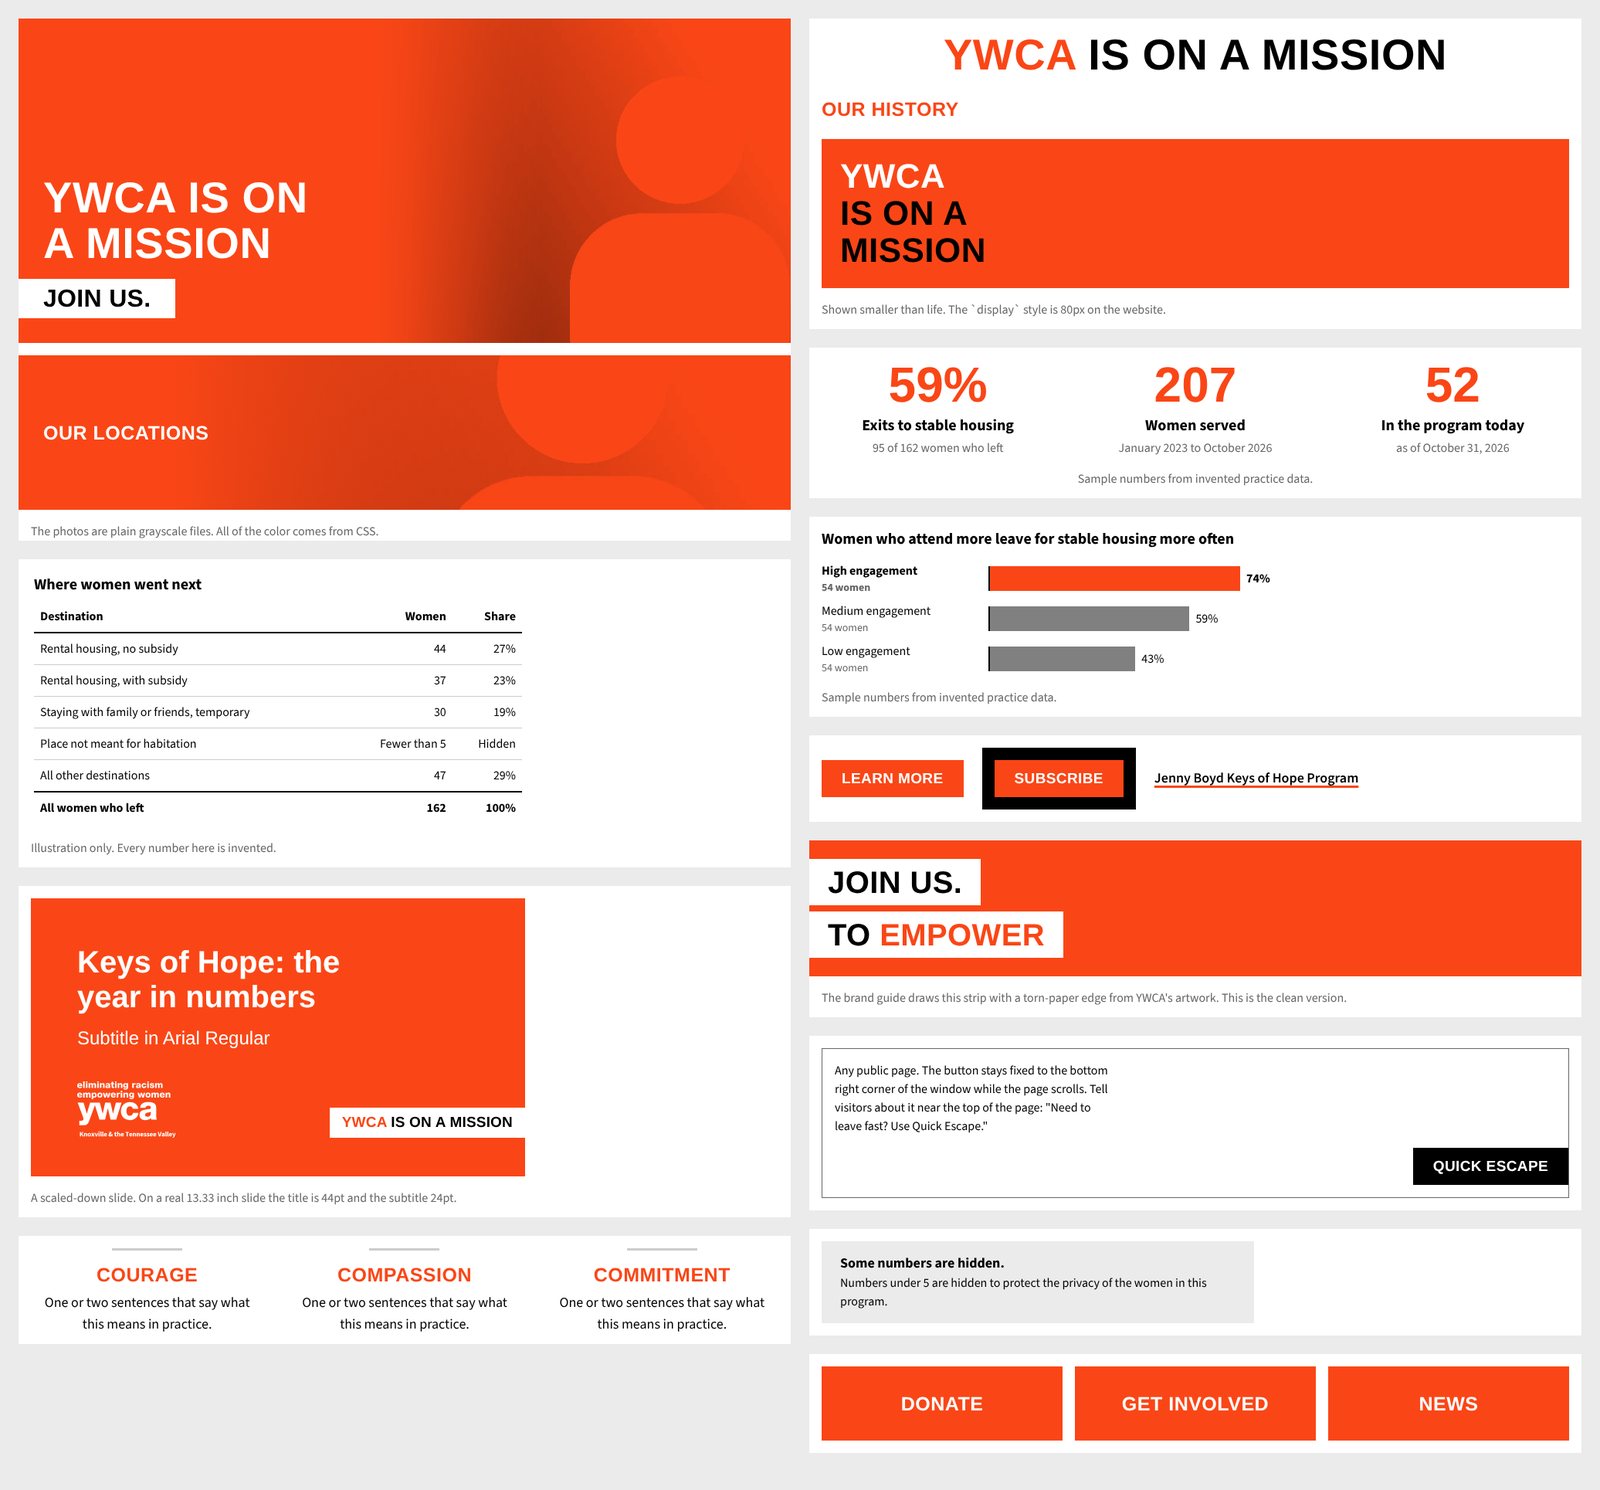
Twelve of the kit's page parts on one sheet: a persimmon photo band with a heavy white headline, a two-color headline, three big-number tiles, a bar chart with one persimmon bar and two gray bars, a plain data table with one count shown as Fewer than 5, buttons, a white call-to-action strip, a slide title, a black Quick Escape button, a gray privacy notice, three value headings, and three action tiles.
Some of the kit's page parts. This page is built from them. The sample numbers are invented.

For Keys of Hope staff: the Friday routine

  1. Export

    Four tables come out of the database as Excel files.

  2. Save

    They go in one folder, in place of last week's.

  3. Refresh

    One click, and "Last updated" shows today's date.

About five minutes a week. So far the report has only run on made-up data. The first run on real records, on a YWCA computer, is the next step.

How the women are protected

Many women in YWCA programs are survivors of domestic violence. These three rules start there.

No real records

Every number in every picture is made up. No real resident data is on any volunteer laptop, in our online project folders, or on this page.

Small groups stay hidden

Any group smaller than five women shows as "Fewer than 5" or is hidden.

Names never load

The report never loads names, phone numbers, emails or birth dates. Export files stay with YWCA.

What's tested, and what isn't

  • The report works on made-up data shaped exactly like the real exports.
  • It has not run on real records yet. That first run, on a YWCA computer, comes next.
  • Paper sign-in sheets are still typed in by hand. Replacing them is the next thing to build.
  • The low, medium and high workshop groups are placeholders until Amy sets the cutoffs.
  • The design kit is unofficial. YWCA has not reviewed it.

What we'd do next

  • Check every number against real exports.
  • Replace paper sign-in and paper room sheets.
  • Add applications and program fees.
  • Later: a counselor's view of one woman's progress.
  • Later: pages for YWCA's other programs.

These are our proposals. Nobody at YWCA has approved them. They are Amy's to decide.

Thank you, by name

  • Amy Shelton

    YWCA Director of Social Services

    Brought the problem and the hope. Made the calls on what success means and who the report is for.

  • Bryan Terrill

    Design lead

    Ran the morning at the whiteboard with Amy: who touches the program, then a woman's path from application to exit.

  • Julianna Cutter

    Developer

    Updated the JotForm flow that handles a program qualification step, which used to take many phone calls.

  • Robert Ormand

    Volunteer

    Joined for the afternoon build.

  • Alex Abell

    Team coach

    Built the dashboard and the Power BI report with two AI tools, Claude and Codex, and wrote this page.

Hack for Nonprofits

Thank you to Brandon Bruce and Ellie Kittrell for putting the day together, to 121 Tech Hub, where it happened, and to United Way of Greater Knoxville, its partner. This was the second annual Hack for Nonprofits.

YWCA Knoxville and the Tennessee Valley

Made for the Keys of Hope program at YWCA Knoxville & the Tennessee Valley, by volunteers. This is not an official YWCA page.

Before the event, we asked Amy who would keep this running after the volunteers went home. She wrote:

"Me, Amy Shelton. I hope to expand this to our other program departments."